Mindset
You need less than you think: the case for a smaller number
Cutting CHF 1,000 from monthly spending can move your independence date by years. Where the money really goes and how to cut without feeling poorer.
Your savings rate matters more than your income: it decides both how fast your money grows and how much you need.
You save 60.0% of your income. At that pace you reach CHF 1’200’000 in about 11.7 years, without counting pensions.
| Savings rate | Years to independence |
|---|---|
| 10.0% | 47.3 years |
| 20.0% | 34.3 years |
| 30.0% | 26.3 years |
| 40.0% | 20.4 years |
| 50.0% | 15.7 years |
| 60.0% | 11.7 years |
| 70.0% | 8.3 years |
Estimates for planning, not advice. Use at your own risk. Read the full disclaimer
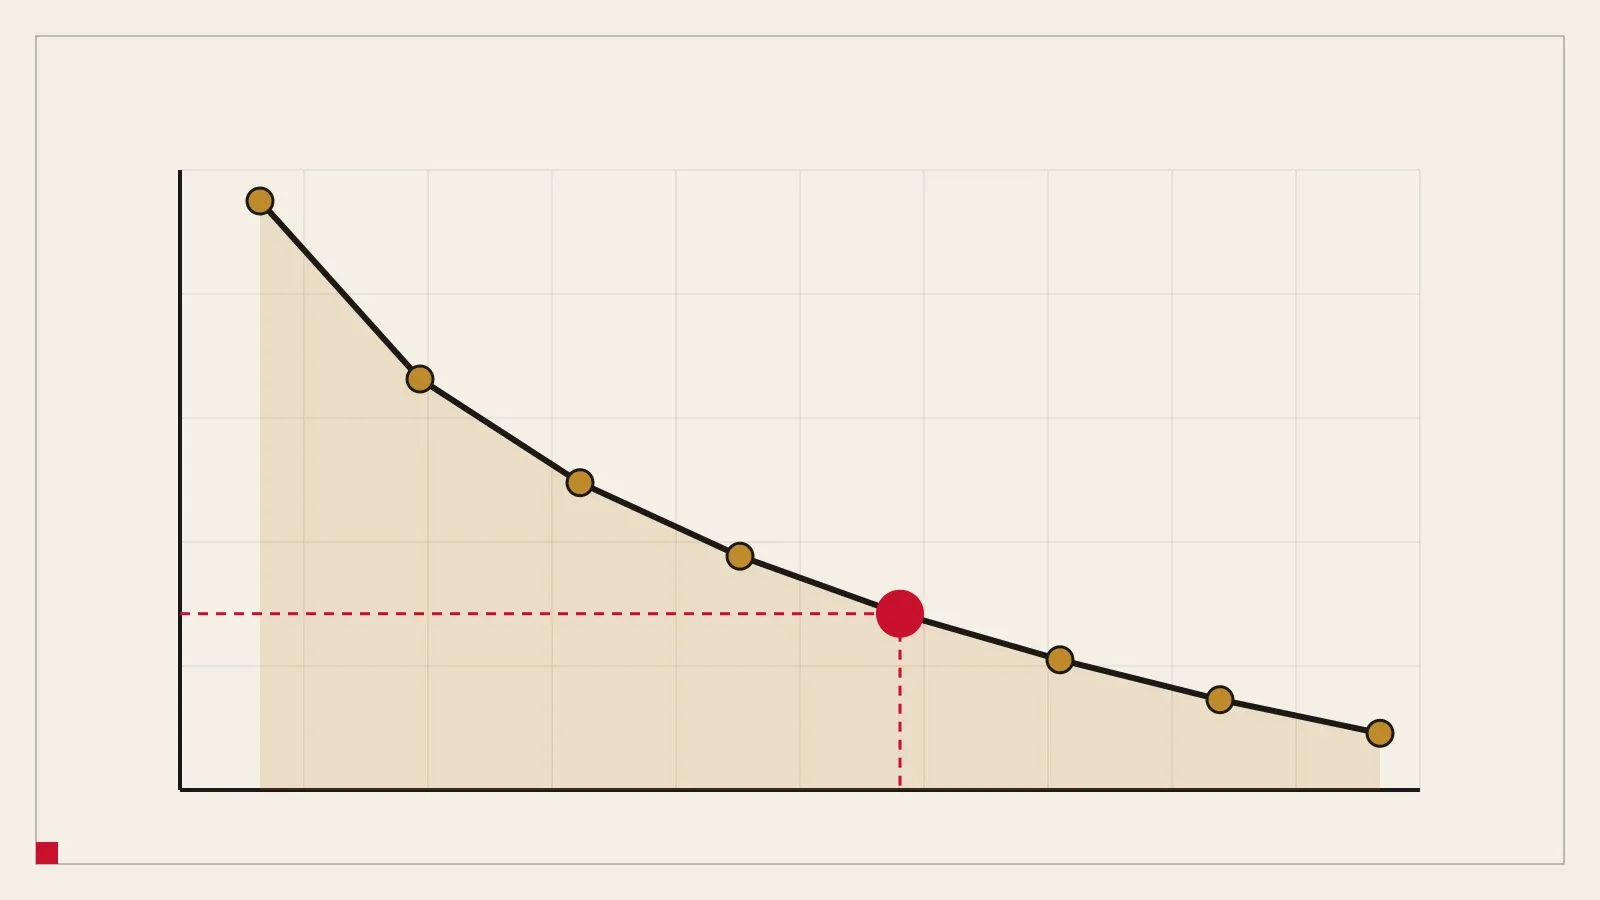
The table shows the same arithmetic for other savings rates, so you can see where the curve flattens. Lower spending works twice: you save more and you need less. More in savings rate and years to freedom.
Context
Real index returns, before inflation and fund costs. Our default for stocks is 8.0% a year; the last two decades were stronger, and they included a 67 % fall in francs.
| Index | Period | Currency | Per year |
|---|---|---|---|
| S&P 500with dividends | 2006–2025 | USD | 10.9% |
| MSCI Worldwithout dividends (add about 2 %) | Oct 2016–Sep 2026 | CHF | 9.4% |
| Swiss equitieswith dividends | 2009–2025 | CHF | 8.5% |
Past returns do not predict future returns. Sources: chartrow.com, msci.com, pictet.com. Try these returns in the calculator →
Any rate you can keep. From zero savings, 20 % means roughly four decades of work, 50 % about two. Each step up shortens the road from both ends.
Net, take-home pay. Pension-fund contributions are already deducted from it and grow separately.
This tool shows the pure savings arithmetic. AHV and the pension fund make the real road shorter; the full calculator includes them.
Mindset
Cutting CHF 1,000 from monthly spending can move your independence date by years. Where the money really goes and how to cut without feeling poorer.
The numbers
Your savings rate, not your salary, decides how many years you need. A table from 10% to 80% shows 66 years at the low end and 6 at the high end.
Last reviewed: